Numerical validation
Fixed calculations
Analytic checks cover exact two-means partitions, S2M stopping, SAVS thresholding, DSS convex optimality, Gaussian conditional draws and the conjugate ridge posterior. Fixed selection and sparse-coefficient results also agree with the repaired installed R VsusP 1.0.0.9000 on R 4.5.0. This reference is not the released CRAN version. Python's default clustering is deterministic; R's is not.
Native posterior checks
Four fixed seven-observation inputs compare Gibbs draws with numerical integration. Horseshoe checks use one predictor with weak or strong fitted signal. Spike-and-slab checks use two orthogonal or correlated predictors. Each uses four chains with 2000 burn-in and 4000 retained draws per chain.
| Check | Maximum rank R-hat | Minimum bulk ESS | Minimum tail ESS |
|---|---|---|---|
| Horseshoe, weak signal | 1.0017 | 2415 | 2560 |
| Horseshoe, strong signal | 1.0000 | 12322 | 13246 |
| Spike-and-slab, orthogonal | 1.0011 | 2504 | 2504 |
| Spike-and-slab, correlated | 1.0074 | 413 | 400 |
ESS means effective sample size. Compared quantities include coefficient first and second moments, mean residual variance and, for spike-and-slab, inclusion and complete-model probabilities. Quadrature refinements changed the targets by less than 5e-11. Every discrepancy was within the prespecified audit tolerance: the larger of 0.01 and five estimated Monte Carlo standard errors. These broad audit thresholds diagnose large errors; they do not prove exact sampling.
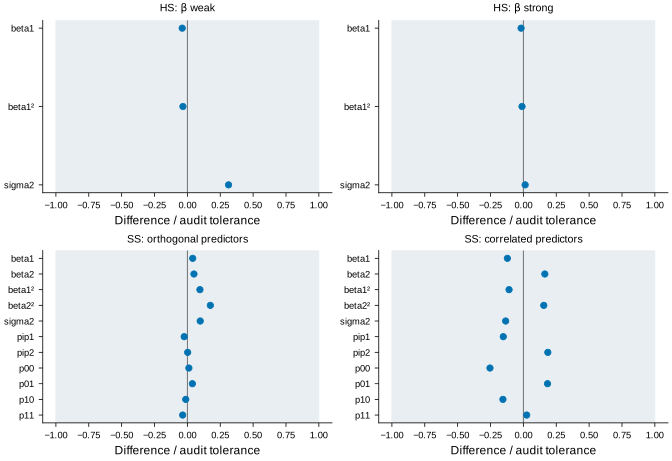
The plotted band is a numerical acceptance rule, not a confidence interval.
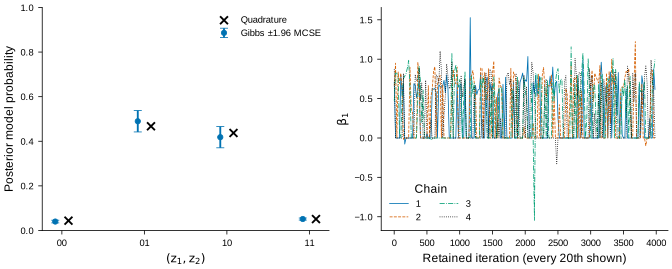
Error bars show ±1.96 estimated Monte Carlo standard errors. Every twentieth retained draw is shown in the traces; all draws enter summaries. The model labels give the two inclusion states. See the numeric results and plot values.
Interpretation
These are low-dimensional posterior checks. They do not establish general selection accuracy, repeated-dataset interval coverage or high-dimensional mixing. The full Li–Pati simulations and lymphoma analysis have not been reproduced. Platform checks are recorded separately from statistical checks.